Trend and Forecasting
See where things are headed — before everyone else does.
Averisys — an AI‑based decision intelligence data analytics platform — spots the patterns in your historical data and tells you what's coming next.
Trusted by leading organizations






Stop reacting. Start anticipating.
Sales numbers, support tickets, energy usage, patient volumes — whatever you're tracking over time, Averisys spots the patterns and tells you what's coming next. No more guessing from charts or waiting for last month's report.
Averisys looks at your historical data, finds the trends and seasonal patterns, and gives you a clear forecast you can plan around — along with a plain-English explanation of what it means.
What you can do
- Forecast demand, revenue, costs, or workload weeks or months ahead
- Spot upward or downward trends before they become problems
- See whether a recent change (new campaign, policy, product launch) actually made a difference
- Get early warnings when something drifts outside the normal range
- Share clear, visual forecasts with your team — no spreadsheet gymnastics
See the trend. Know the forecast.
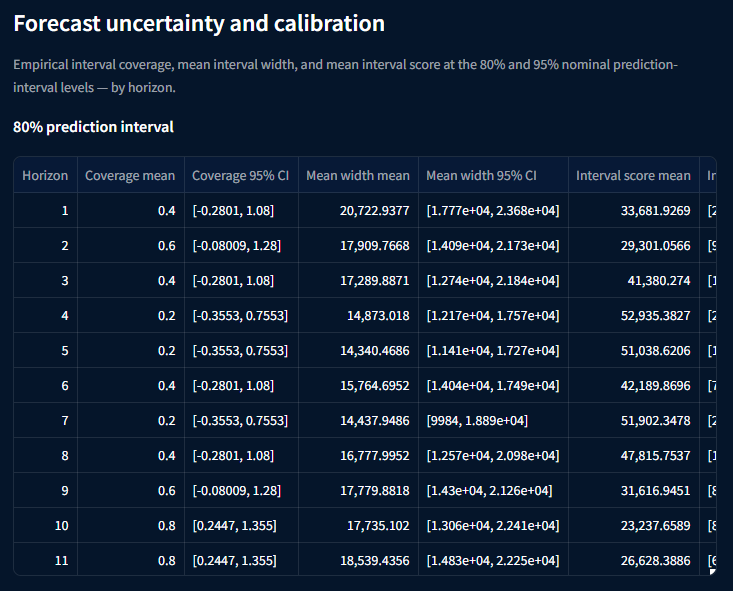
01 / Forecast uncertainty and calibration.
Averisys trains a gradient boosting (LightGBM) model on the historical series and projects the measure multiple steps ahead. Every forecast is reported with an honest estimate of uncertainty, so you can plan around a range instead of a single number.
- Empirical interval coverage at 80% and 95% nominal prediction levels
- Mean interval width and interval score by forecast horizon
- Coverage confidence intervals so you can judge reliability
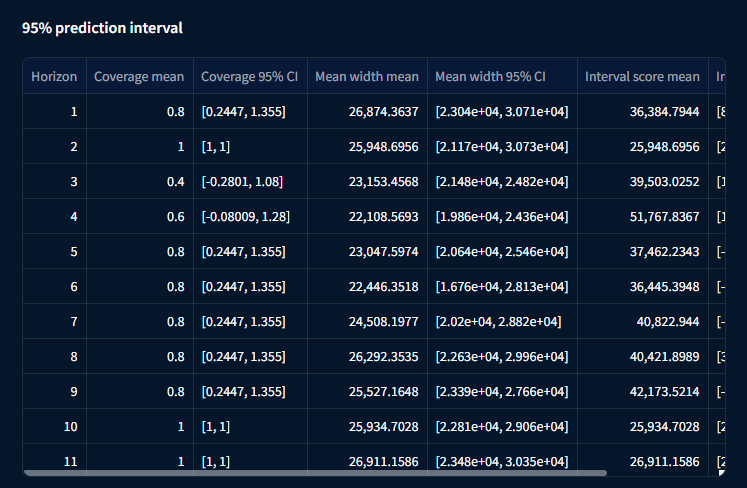
02 / 95% prediction interval.
The 95% prediction interval gives a wider, more conservative range for longer-range decisions. Averisys reports coverage, width, and score at each horizon so you know when the forecast is confident and when it is naturally more uncertain.
- Horizon-by-horizon coverage mean and 95% confidence interval
- Mean interval width with its own uncertainty band
- Interval score that rewards narrow intervals when coverage is valid
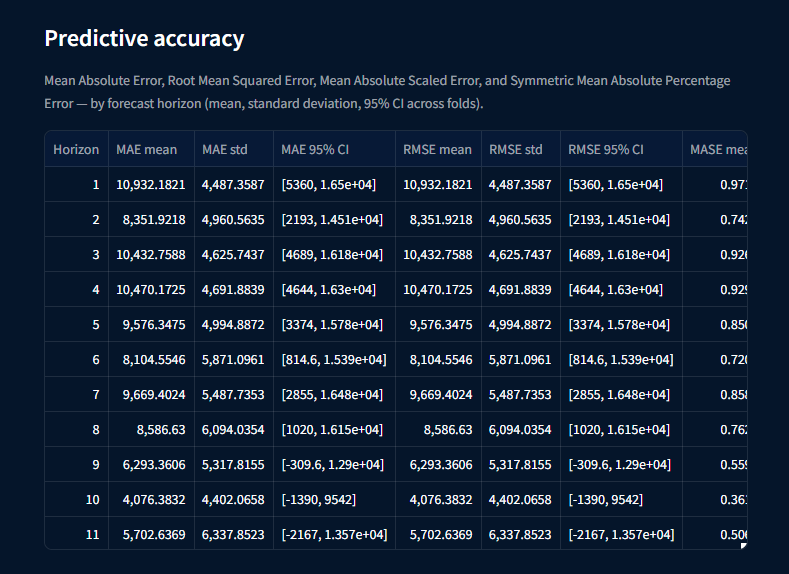
03 / Predictive accuracy.
Accuracy is measured across multiple folds and horizons, not just one holdout set. Averisys reports standard errors and confidence intervals so you know whether a difference in forecast quality is real or just sampling noise.
- Mean Absolute Error (MAE) and Root Mean Squared Error (RMSE) by horizon
- Mean Absolute Scaled Error (MASE) for scale-free comparison
- Symmetric Mean Absolute Percentage Error (SMAPE) for percentage interpretation
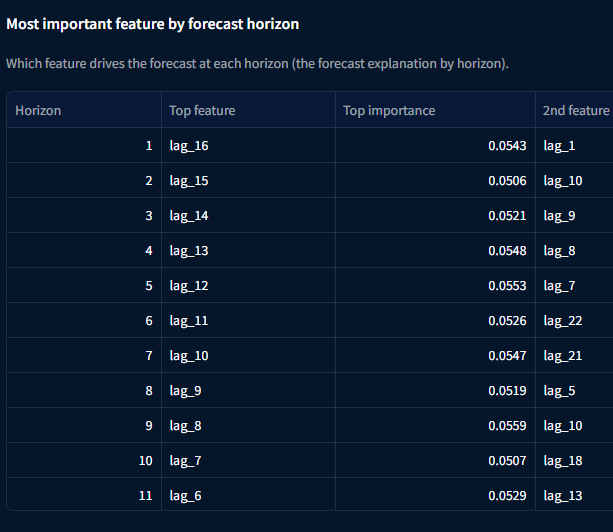
04 / Most important feature by forecast horizon.
Different horizons can be driven by different signals. Averisys shows which lag, rolling mean, or calendar feature carries the most weight at each step, so you understand what the model is reacting to as the forecast extends.
- Top feature and its importance at every forecast horizon
- Second-most important feature for context
- Clear ranking that explains why the forecast changes over the horizon
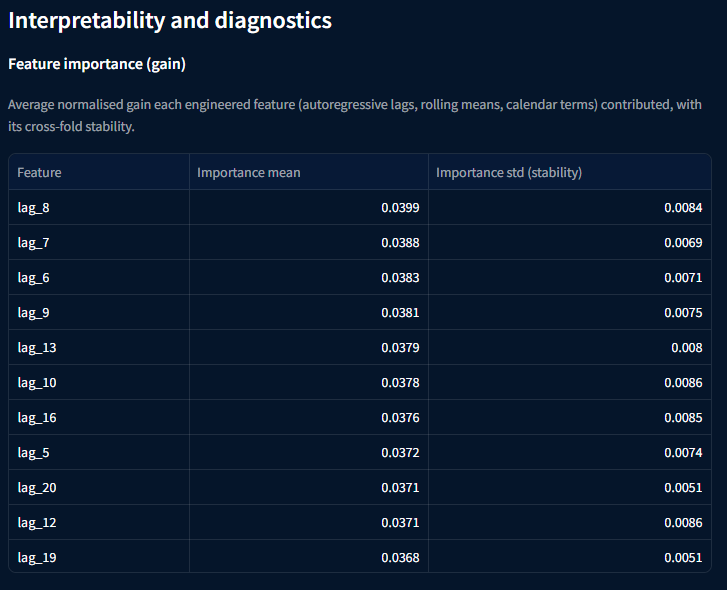
05 / Interpretability and diagnostics.
Feature importance is reported with stability, not just magnitude. Averisys averages normalized gain across engineered features and reports the standard deviation across folds, so you can trust that the drivers are reproducible.
- Average normalized gain for autoregressive lags, rolling means, and calendar terms
- Importance standard deviation as a stability measure
- Ranked list that tells you which inputs the model is actually using
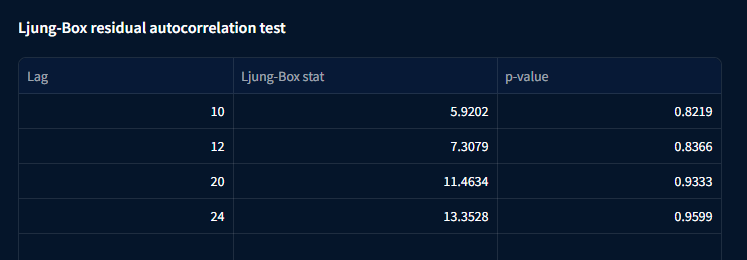
06 / Residual diagnostics.
A good forecast should leave no predictable pattern behind. Averisys runs a Ljung-Box test on the residuals at multiple lags and reports the statistic and p-value, so you can see whether the model has captured the time-series structure.
- Ljung-Box statistic at lags 10, 12, 20, and 24
- p-values that flag remaining autocorrelation
- A clean residual check before the forecast is trusted
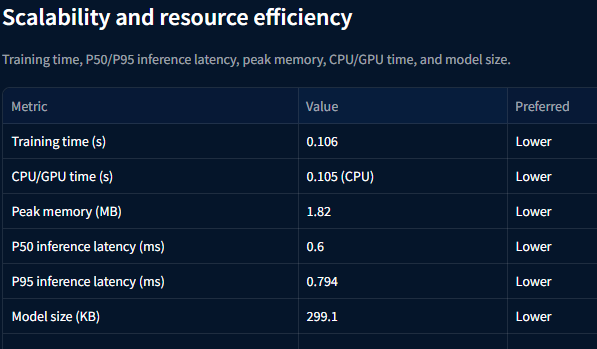
07 / Scalability and resource efficiency.
Speed and footprint matter when forecasts are refreshed daily or scored in real time. Averisys reports training time, inference latency, peak memory, and model size so you know the model can keep up with your operational rhythm.
- Training time and CPU/GPU time in seconds
- Peak memory use and model size on disk
- P50 and P95 inference latency for real-time scoring
Averisys Analytics guarantees its security.




Ready to see what's coming next?
Watch a demo and discover how Averisys — an AI‑based decision intelligence data analytics platform — spots the trends in your data, forecasts what's ahead, and tells you exactly what to do about it.