Time-to-Event Analysis
Know when things will happen — and what's speeding them up or slowing them down.
Averisys — an AI Data Analytics Platform — analyzes timing outcomes and tells you not just whether something will happen, but when and why.
Trusted by leading organizations






Timing is everything
How long until a customer cancels? When will equipment need replacing? How quickly do patients recover after a new treatment? These are timing questions — and they require a different kind of analysis.
Averisys analyzes "time-to-event" outcomes and tells you not just whether something will happen, but when it's most likely to happen and which factors are accelerating or delaying it.
What you can do
- Predict how long until customers churn, contracts lapse, or equipment fails
- Compare groups to see which ones reach the event faster (or slower)
- Identify the factors that have the biggest impact on timing
- Spot high-risk segments early — before the event happens
- Test interventions: will a new program actually delay churn, failure, or relapse?
See the timeline. Understand the risk.
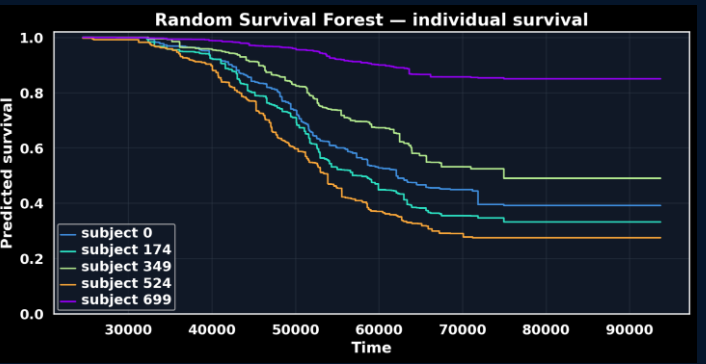
01 / Random Survival Forest.
Averisys fits a Random Survival Forest to your data and produces individual survival curves for every subject — showing how the predicted probability of remaining event-free changes over time.
- Personalized survival curves for each subject or record
- Clear separation between high-risk and low-risk cases
- Step-function timelines that match the structure of real event data
- Visual output ready for reports, dashboards, or stakeholder presentations
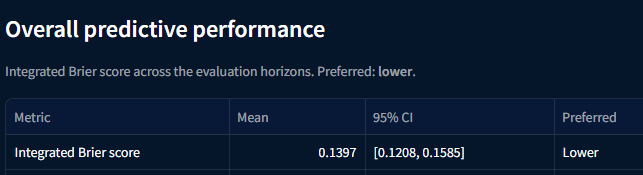
02 / Overall predictive performance.
The model's overall accuracy is summarized with the integrated Brier score — a single number that measures how close the predicted survival probabilities stay to the actual outcomes across the whole forecast horizon.
- Integrated Brier score reported with mean and 95% confidence interval
- Lower scores mean sharper, more reliable survival forecasts
- Confidence interval shows stability across cross-validation folds
- Plain-English interpretation of how well the model is expected to perform
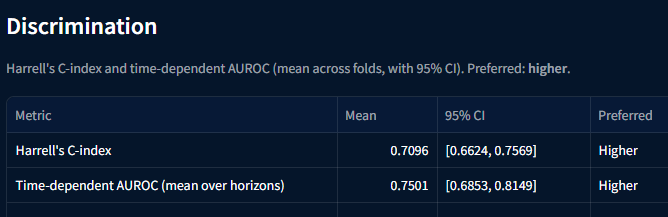
03 / Discrimination.
Discrimination tells you whether the model can reliably separate subjects who will experience the event soon from those who will not. Averisys reports Harrell's C-index and time-dependent AUROC with confidence intervals.
- Harrell's C-index for rank-order accuracy across the full timeline
- Time-dependent AUROC averaged over forecast horizons
- 95% confidence intervals for both metrics
- Clear guidance on whether the model's ranking is strong enough for decisions
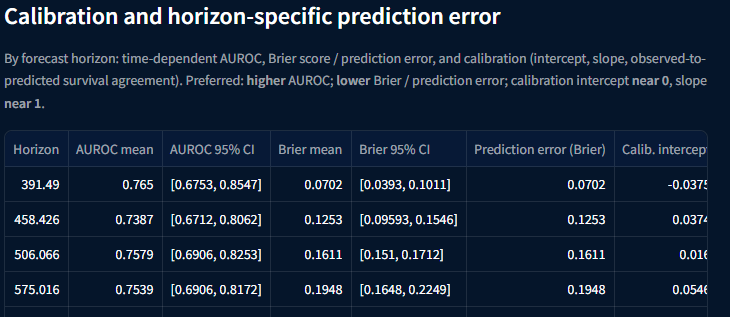
04 / Calibration and horizon-specific prediction error.
A model can rank well but still be overconfident. Averisys checks calibration at each forecast horizon — comparing predicted survival against observed survival — and reports prediction error so you know when to trust the numbers.
- Horizon-by-horizon AUROC and Brier score tables
- Calibration intercept and slope to detect over- or under-confidence
- Prediction error broken out by forecast horizon
- Interpretation of whether forecasts are well-calibrated across time
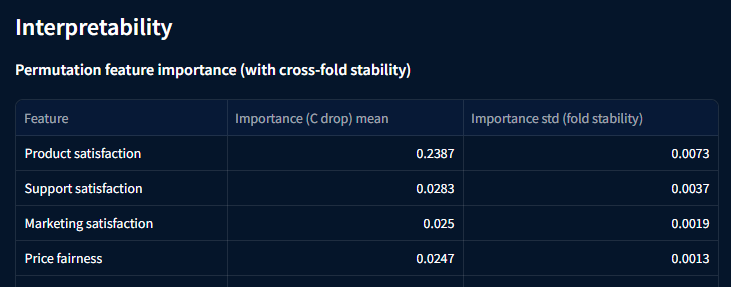
05 / Interpretability — permutation feature importance.
Averisys ranks the factors that most affect survival time using permutation feature importance. Each feature is shuffled and the drop in model performance is measured — larger drops mean bigger influence.
- Feature importance ranked by mean C-index drop
- Cross-fold stability reported as a standard deviation
- Confidence in which factors truly matter, not just which appear first
- Plain-English takeaways tied to business actions
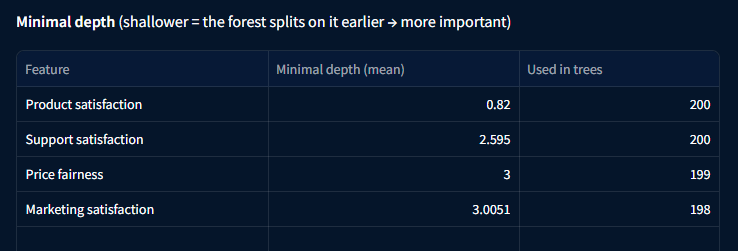
06 / Minimal depth.
Minimal depth is a second, model-native way to see what matters. Features that split the forest earlier and are used in more trees are the ones the model relies on most for survival predictions.
- Average minimal depth for each feature across all trees
- Count of how many trees actually use each feature
- Shallower depth + higher usage = stronger predictive role
- Cross-checks against permutation importance for robust conclusions
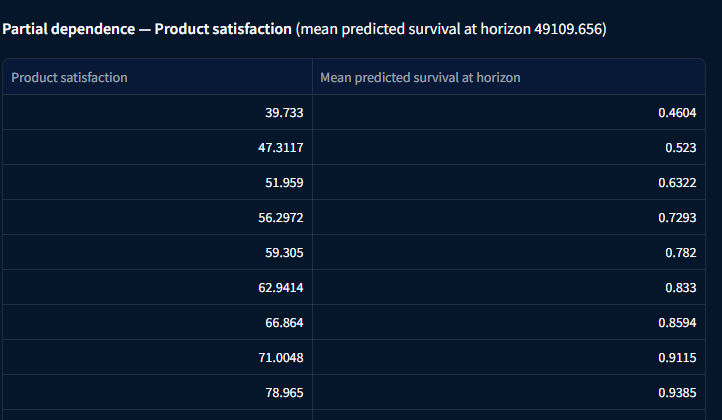
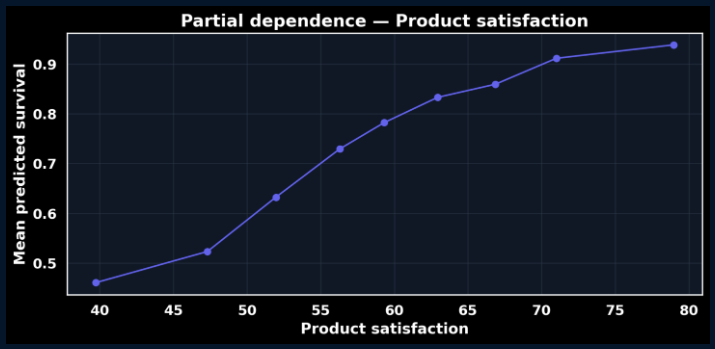
07 / Partial dependence.
Partial dependence shows how changing one factor affects predicted survival, holding everything else constant. The table and chart together make the relationship easy to read and act on.
- Mean predicted survival at each level of the selected factor
- Smooth curve showing the direction and shape of the relationship
- Quantified impact so you can compare interventions
- Example: higher product satisfaction is tied to higher predicted survival
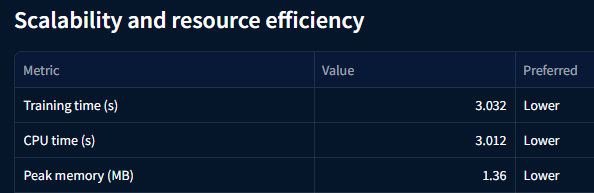
08 / Scalability and resource efficiency.
Averisys trains and evaluates the Random Survival Forest efficiently, with transparent resource metrics so you know how much time and memory the analysis needs.
- Training time, CPU time, and peak memory reported in seconds and MB
- Fast enough to iterate and compare model configurations
- Resource footprint stays low even with many records and features
- Clear reporting supports governance and infrastructure planning
Averisys Analytics guarantees its security.




Ready to predict the timing that matters most?
Watch a demo and discover how Averisys — an AI Data Analytics Platform — predicts when events will happen, identifies what's driving the timing, and tells you exactly what to do about it.