Relationship — Neural SEM
Map how your drivers connect — with results you can verify.
Averisys — an AI Data Analytics Platform — uses Neural SEM to estimate direct, indirect, and total effects across a whole system of drivers, and reports every result with standard errors, confidence intervals, and validation evidence.
Trusted by leading organizations






See the pathways. Trust the numbers.
Does onboarding quality drive retention directly, or does it work through customer engagement first? Neural SEM answers questions like these by estimating the full path structure at once — the direct effect, the indirect effect that travels through a mediator, and the combined total.
Averisys reports each estimate in plain English alongside the evidence a reviewer would ask for: how well the model reproduces the data, how accurately it recovers known relationships, how stable it is across runs, and how much time and memory it takes to run.
What you can do
- Quantify direct, indirect, and total effects across a system of drivers
- Confirm which pathways are statistically meaningful, with confidence intervals and p-values
- Check that the concepts you measure are reliable before acting on them
- Validate accuracy, stability, and predictive strength on held-out data
- Share reviewer-ready evidence with your team in minutes
Evidence behind every pathway
01 / Functionality — path estimates
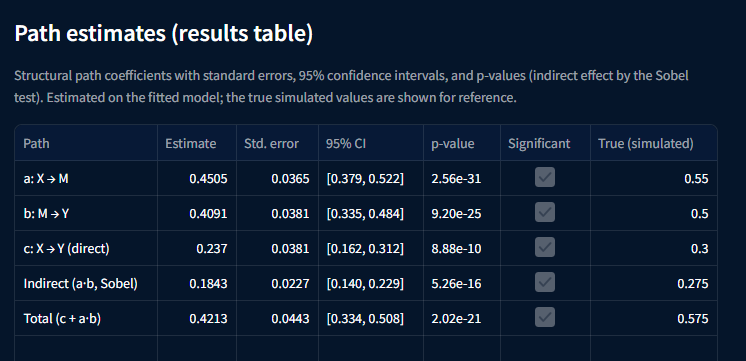
Every structural path is reported with its estimate, standard error, 95% confidence interval, and p-value — with the indirect effect tested using the Sobel test.
- Direct path X → Y estimated at 0.237 [0.162, 0.312]
- Indirect path through the mediator (a·b) at 0.1843 [0.140, 0.229]
- Total effect (c + a·b) at 0.4213 [0.334, 0.508], all significant
- Estimates sit next to the true simulated values for a like-for-like check
02 / Measurement quality
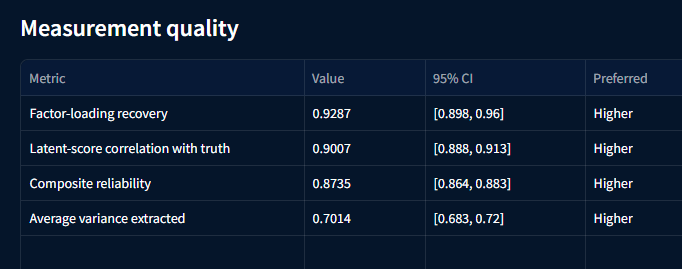
Before interpreting pathways, Averisys confirms the underlying concepts are measured well.
- Factor-loading recovery 0.9287 [0.898, 0.96]
- Latent-score correlation with truth 0.9007 [0.888, 0.913]
- Composite reliability 0.8735 [0.864, 0.883]
- Average variance extracted 0.7014 [0.683, 0.72]
03 / Structural recovery
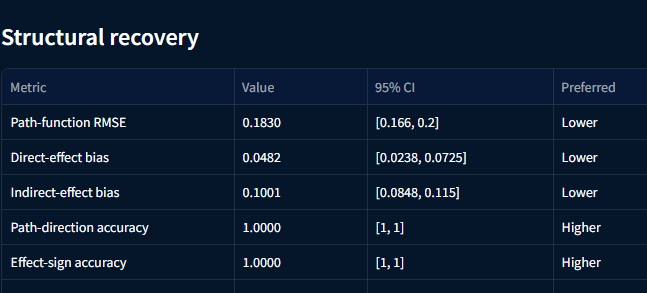
Tested against known relationships, the model recovers the structure with low bias and perfect directional accuracy.
- Path-function RMSE 0.1830 [0.166, 0.2]
- Direct-effect bias 0.0482; indirect-effect bias 0.1001
- Path-direction accuracy 1.0000
- Effect-sign accuracy 1.0000
04 / Predictive performance
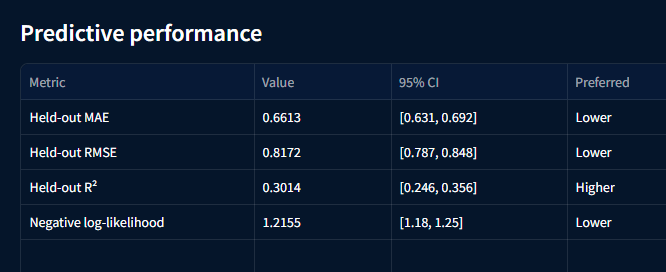
Accuracy is measured on held-out data, so the model is judged on cases it has never seen.
- Held-out MAE 0.6613 [0.631, 0.692]
- Held-out RMSE 0.8172 [0.787, 0.848]
- Held-out R² 0.3014 [0.246, 0.356]
- Negative log-likelihood 1.2155 [1.18, 1.25]
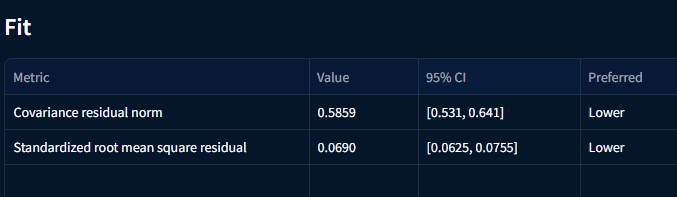
05 / Fit
Fit diagnostics show how closely the estimated model reproduces the observed relationships in the data.
- Covariance residual norm 0.5859 [0.531, 0.641] — lower is better
- Standardized root mean square residual 0.0690 [0.0625, 0.0755]
- Residuals well inside conventional thresholds for good fit

06 / Uncertainty
Confidence intervals are checked for honesty — do they actually contain the truth as often as they claim?
- Confidence-interval coverage 1.00, at or above the nominal 0.95 target
- Intervals reported for every path, loading, and performance metric

07 / Robustness
Results should not change because the model was run again on a different day.
- Convergence success rate 1.00 — the model estimates reliably every run
- Performance variability across seeds 0.0403 (SD of the direct effect)
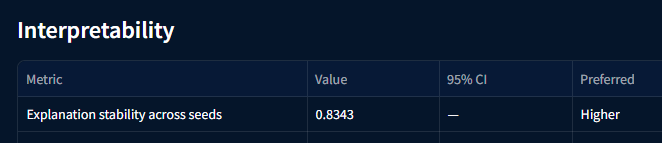
08 / Interpretability
The explanation you present to stakeholders stays consistent when the analysis is repeated.
- Explanation stability across seeds 0.8343 — higher is better
- Driver rankings and pathway stories hold up across runs
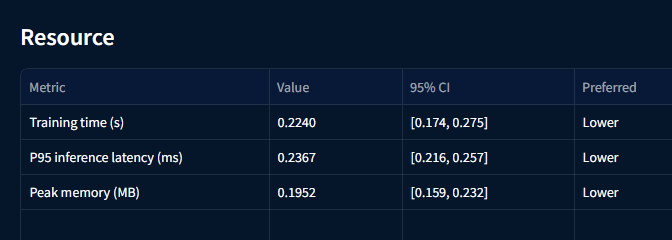
09 / Scalability and resource
Neural SEM runs fast and light, so analyses can be refreshed as often as decisions require.
- Training time 0.2240 s [0.174, 0.275]
- P95 inference latency 0.2367 ms [0.216, 0.257]
- Peak memory 0.1952 MB [0.159, 0.232]
Averisys Analytics guarantees its security.




Ready to map the pathways that matter?
Watch a demo and see how Averisys — an AI Data Analytics Platform — uses Neural SEM to quantify direct and indirect effects, validate them, and explain what to do next in plain English.