Repeated Measures
Track changes over time within the same subjects — and discover whether interventions, treatments, or conditions make a measurable difference.
Trusted by leading organizations






Averisys helps you analyze data collected from the same subjects at multiple time points — whether you're evaluating a single group's trajectory or comparing how two or more groups evolve differently over time. The platform selects the right repeated‑measures design, validates assumptions, and uses the AI Assistant to translate statistical output into clear, actionable insights.
When repeated‑measures analysis is the right choice
Use a repeated‑measures approach when you want to understand:
- How an outcome changes over time within the same subjects (e.g., follow‑up assessments at 1 week, 1 month, 3 months, 6 months)
- Whether groups differ in their trajectories (e.g., Treatment vs. Control over multiple follow‑ups)
- Whether an intervention effect grows, fades, or reverses across time points
Averisys supports both repeated‑measures ANOVA (single group, multiple time points) and mixed ANOVA (multiple groups × multiple time points), automatically handling sphericity corrections and interaction effects.
What Averisys delivers
Repeated‑measures ANOVA
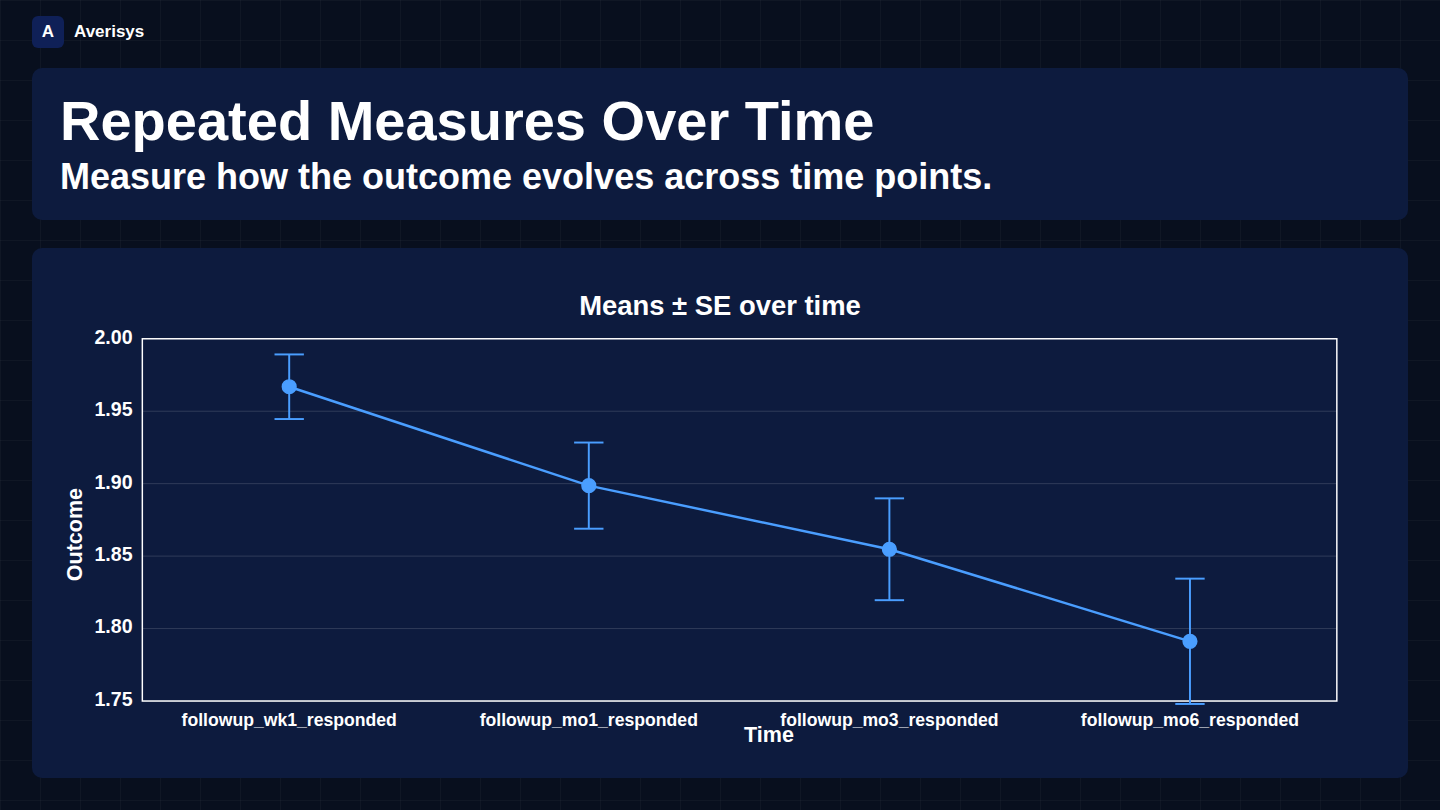
When you're tracking a single group over time, Averisys runs a repeated‑measures ANOVA and visualizes how the outcome evolves across time points:
- Mean outcome at each time point with standard error bars
- Within‑subject F‑test to determine if changes across time are statistically significant
- Sphericity checks (Mauchly's test) with Greenhouse‑Geisser or Huynh‑Feldt corrections when needed
- Effect sizes (partial η²) to quantify the magnitude of change
This design is ideal for pre/post studies, longitudinal tracking, and any scenario where the same participants are measured repeatedly.
Mixed ANOVA (Group × Time)
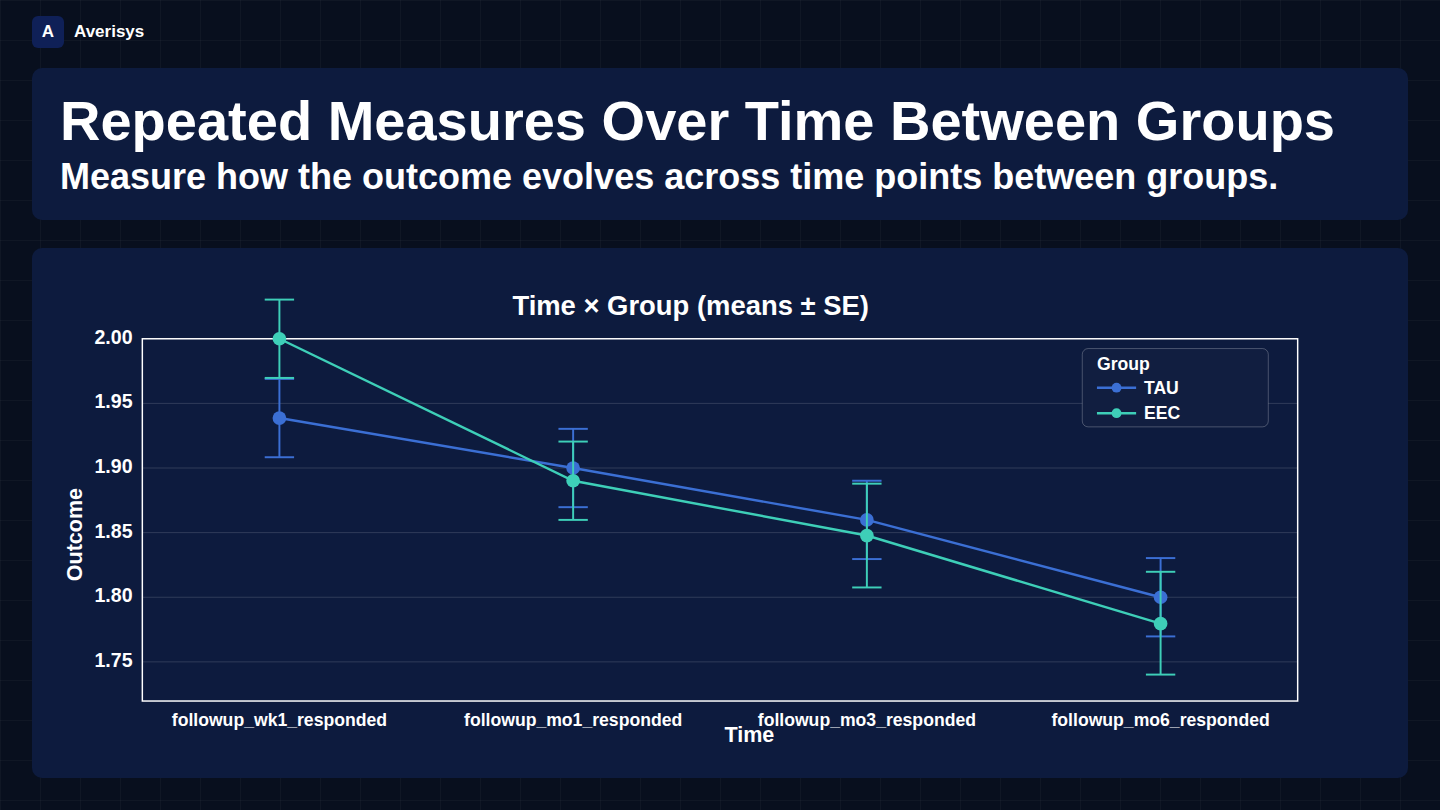
When you need to compare how different groups change over time, Averisys runs a mixed ANOVA that tests three key effects simultaneously:
- Group effect: Do the groups differ overall?
- Time effect: Does the outcome change across time points?
- Interaction (Group × Time): Do the groups change differently over time?
The interaction plot clearly shows whether one group improves faster, diverges, or converges with the other — making it easy to evaluate intervention effectiveness.
Why teams use Averisys for repeated‑measures analysis
- Automatic design detection: Repeated‑measures or mixed ANOVA based on your data structure
- Sphericity handling: Automatic corrections when the assumption is violated
- Interaction visualization: Clear plots showing how groups diverge over time
- Decision‑oriented interpretation: AI explains outcomes and recommends next steps
- Stakeholder‑ready reporting: Executive summaries and clear narratives
Trusted by leading organizations
Averisys Analytics guarantees its security.




Ready to analyze repeated‑measures data with AI‑guided interpretation?
Averisys handles the complete workflow — design selection, assumption checks, statistical testing, interpretation, next steps, and reporting — so you can make confident decisions from longitudinal data.